If part one was visualising all ways to play a game, this part will illustrate how it is actually played.

In the first part of Visualising games as fractals the images were created by exploring all possible ways to play a game. This is a good way to visualise a game at its core, but what about the strategy that only the players can bring?
Well… by extending the process it is possible visualise two people playing against each other at varying levels of skill. If part one was visualising all ways to play a game, this next post will illustrate how it is actually played.
Recap

Figure 1: All ways to play (3-depth)
Looking back on our 3-depth example, the image illustrates the win rate of player 1 for every possible way to play Noughts and Crosses, up to the third turn. I have annotated parts of the image with an ‘X’ or ‘O’, showing player 1’s or player 2’s moves respectively.
As you can see, each 3×3 region is a ‘snapshot’ of a different version of the game and in this way all possible games can be shown.
Tiles that have been marked with an ‘X’ or ‘O’ can no longer be chosen again, the player must choose out of the remaining blank tiles. We will use this notion of ‘valid’ and ‘invalid’ tiles later to highlight player tactics, moving away from colouring by result for now and instead using a grey-scale palette. In this way we just want to show which tiles each player is allowed to (or even should) choose on each turn.
Showing just the moves

Figure 2: Grey-out marked tiles

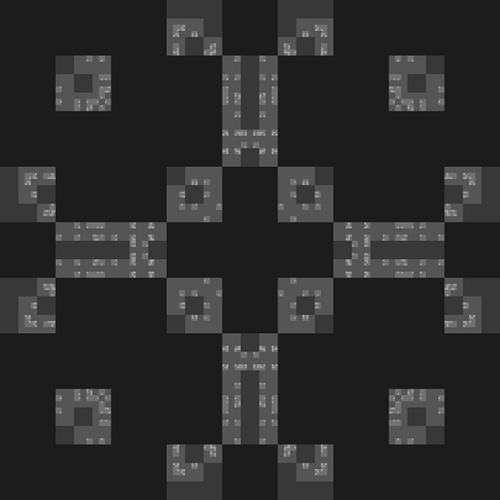
Figure 3: 8-depth
By colouring the image in this way we are ignoring the win rate and simply focusing on showing the moves available at each turn. Looking at Figure 2, you can see that all the marked tiles, from Figure 1, have been blacked-out. You may also notice a slight difference in shade too. The tiles are shaded by their corresponding depth, with the darkest tiles being ‘first’ and progressively getting lighter the deeper we go. By using shading for the depth we can get an idea of which moves are ruled out when.
Instead of visualising the win rate, which can give an impression of how fair a game is, visualising only the depth reached makes it clearer to see the structure of a game. You can see with each layer the moves that are no longer valid. These invalid moves are not allowed by the game’s rules, but the same method can be used to show player choice as well. Decisions the player would never choose to make, as it may be a big disadvantage or cause them to lose, can be displayed as ‘invalid’ in exactly the same way.
Making the right move

Figure 4: Win in one move
Take Figure 4 as an example, where it is X’s turn. They have a choice of 5 tiles, but only one will result in an instant win (bottom right). In our previous visualisations, all 5 tiles would have been explored and coloured, irrespective of which move was better. If we assume player ‘X’ does not wish to torment ‘O’ and aims to win the game as quickly as possible, there is only one choice to make. As such, when it comes to visualising this choice, only the bottom right tile will be explored and the rest of the tiles will be marked as unavailable.

Figure 5: Looking two moves ahead
Looking at Figure 5, the choice is less obvious for player ‘X’. Whereas in our previous example we were only required to look one move ahead, Figure 5 requires looking at least two moves ahead in order to see a possible loss to player ‘O’ and to avoid it.
So depending on the foresight of a player (number of moves they can think ahead), some types of games will never be played and can be left blank in the visualisation.
Impact of player foresight

**Figure 6: Players with increasing foresight (1 – 6)
The six images in Figure 6 illustrate two players facing each other, both having increasing ‘foresight’, where the image to the far left represents both players being able to think one move ahead, up to the far right for 6 moves for each.
Visualising a game where both players had zero foresight would look like Figure 3 and would come before the first image in Figure 6. With a foresight of zero, even if one of the players is one move away from winning, they would have no idea, being just as likely to choose any of the other moves which won’t win them the game.
If this level of play is akin to a pair of monkeys playing, then with perfect foresight we could see what kind of games result when two gods have a go. (Cue the Min-Max algorithm)

Figure 7: Players with increasing foresight (2 – 5)
Looking at each illustration with increasing foresight it is possible to notice major changes in player tactics at a glance by looking at the different patterns. In some cases, the pattern fundamentally remains the same but becomes more sparse, like in the 2-3 and 4-5 foresight examples (Figure 7). This would mean the players are sticking to the same tactics, but with additional foresight notice some moves are no longer viable. Whereas in other cases the patterns change drastically, like in 3-4 foresight. This could result from players noticing viable plays with moves they previously ruled out.
There are likely many other reasons, especially in more complex games, but the images do a good job in highlighting these situations and encourage exploring the reasons why.

By the time both agents can look 6 moves ahead the range of games played has been reduced significantly. In fact increasing the foresight further to 7, 8 or 9 does not change the results and so you will get the same image.
There are 255,168 different ways to play the game of Noughts and Crosses, however there are only 3,584 ways once you can think 6 moves ahead (at least by my rules). That’s only about 1.4% of the game!
The trap

Figure 8: Both players with a foresight of 6 moves (8-depth)
If you examine Figure 8 you can see that, if player 1 makes their move in a corner, player 2 knows the only way to stand a chance is to make their move in the center tile.

Figure 9: Top left of 5-foresight and 6-foresight respectively
Comparing this with a lower foresight visualisation, if player 2 can only see 5 moves ahead then they can make the mistake of going anywhere other than the center.
The 5-foresight image illustrates that player two, having looked 5 moves ahead, doesn’t see their downfall is lurking just one move further and so has no preference over each tile. The 6-foresight image highlights that player 2 can now see enough moves ahead to know that their only choice is to choose the center as, looking 6 moves ahead, all of the other 7 tiles ends with player 1 winning.
Conclusion
Even though choosing the center tile creates the most opportunities to win, people will often go in the corners because of this trap.
Figure 9 illustrates that if player 2 is unable to think just that one extra move ahead, player 1 can choose a move that requires the other to pick the only move out of 8 which will prevent certain doom. Throw a little psychology into the mix with a first move that isn’t the obvious center, many people would choose to follow along and also avoid the center.
Before this project I wouldn’t have been able to tell you with certainty that I was guaranteed to win in this situation. However I do recall thinking starting in the corner results in more interesting and even somehow a winning game and it is now obvious to me why.
During the project there were some visualisations that confirmed my intuitions and others which caught my eye and revealed interesting quirks of the game, the trap being a bit of both! This is the type of thing I wanted from the project – capturing the intuition we have about games, revealing interesting situations and of course making pretty pictures.
Putting it all together – Result colouring with increasing foresight

0-foresight

1-foresight

2-foresight

3-foresight

4-foresight

5-foresight

6-foresight: All games end it a draw
** Figure 6 was rendered using slightly different rules explained in this blog. Moves that are never chosen were coloured in black, and not by a grey-scale based on depth, to emphasise pattern changes more clearly.