As part of an on-going scheme in the office, we aim to have little internal hackathons every so often to collaborate on a shared goal. This post will take you through how we got on with the first project to come out of 2020 – an office air quality monitor.
As part of an on-going scheme in the office, we aim to have little internal hackathons every so often to collaborate on a shared goal. These goals can be anything, but we try and work on something we all have a shared passion for. With the environmental impact of humans becoming ever more clear and 2019 closing with inspirational efforts such as #TeamTrees, we knew where our passions lay for the start of 2020. This post will take you through how we got on with the first project to come out of the general theme of ‘The Environment’ – an office air quality monitor.
The Brief
Working in central London, many of us in the office are concerned with the air quality we are exposing ourselves to each day. We hear the news stories and vague statistics, but are unsure of how much of it applies to ourselves. Happily, there are increasingly more resources becoming available to tackle the issue, allowing everyone to be better informed and have a greater awareness of what we are coming into contact with on a much more personal level.
Our chosen device may not be for everyone, but is perfect if you want to play around with the data yourself. The Enviro+ board, by Pimoroni, for the Raspberry Pi was surprisingly easy to set it up and start monitoring the air quality in our office. Made with the help of researchers from the University of Sheffield, with the aim of letting anyone contribute real-time air quality data from your local area to open data projects like Luftdaten. Here’s how we got on…
The End Result

By the end we had a working setup which displayed the readings from all (but one) of the sensors in real time. Above we have a web page displaying the data using the d3js library, Chromecast to our office TV.
Live sensor data:
- Temperature
- Humidity
- Pressure
- Light level
- Proximity (not really useful for what we want)
- 3 Gas type readings (carbon monoxide, nitrogen dioxide and ammonia)
- 3 Particulate size readings (<=10µm, <=2.5µm, <=1µm)
Sensors we didn’t manage to hook into:
- Microphone sensor readings


The graphs could do with a bit of improvement and tailored more to the type of data each is displaying and we are still lacking context for some of the readings. I.e. the gas readings – is ‘360,000’ too high? Who knows?! Actually, that brings up a good point… The resources and setup guide available for the Enviro+ are for the most part more than adequate, however when it comes to explaining how to interpret the gas readings, we were left a bit disappointed. Once we work it out ourselves, we will get back to you!
Going Forward

Contributing to citizen science
luftdaten.info is an air quality service which is open to contribute to using devices such as the Enviro+ monitor. As seen on the map, the majority of the data comes from Europe (but that shouldn’t stop you), it provides a heat map collating all the contributed data.
Other air quality websites
Gaining insights
The fun part comes with reviewing the data and looking for trends. For instance, you could imagine a situation whereby during the middle of the day particulates increase, so best open a window… or not? Another thing that would be interesting to know is if the air outside is better than inside – news stories of pollutants accumulating within your car springs to mind, so it would be good to see if we can do anything in the office to make a difference. The hope is once we work out the gas readings there may be a chance to get a useful indication of the CO2 levels in the office which, research has found, has a massive influence on cognitive function. You can see a related YouTube video here. So, not only do we have the potential to improve our health in the office, but also our productivity!
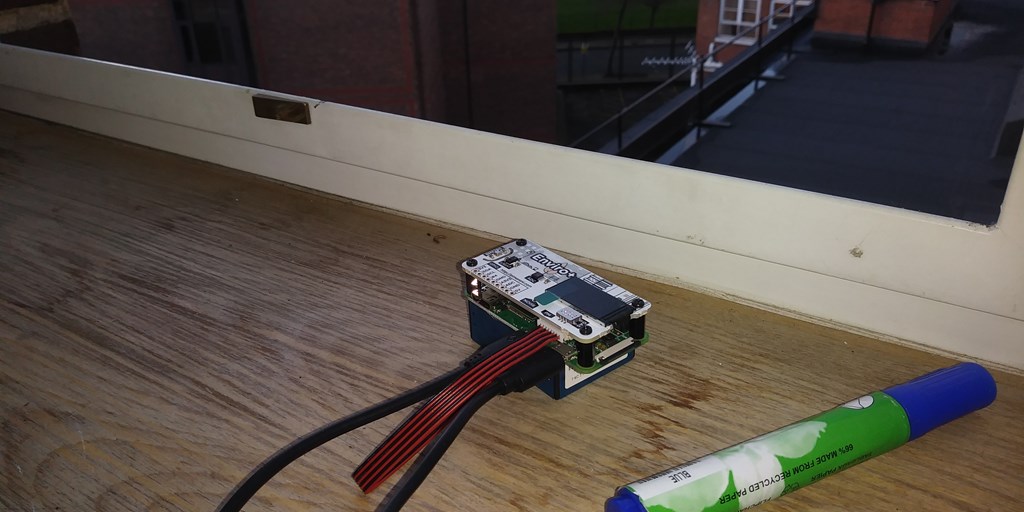
Our Setup
- 1 x Enviro+ air quality board for the Raspberry Pi
- 1 x PMS5003 Particulate sensor
- 1 x Raspberry Pi Zero WH
- 4 x M2.5 standoffs
- 1 x SD card with Raspbian OS
- 1 x Micro USB -> USB adaptor (only used during setup)
- 1 x Micro USB charger
Resources